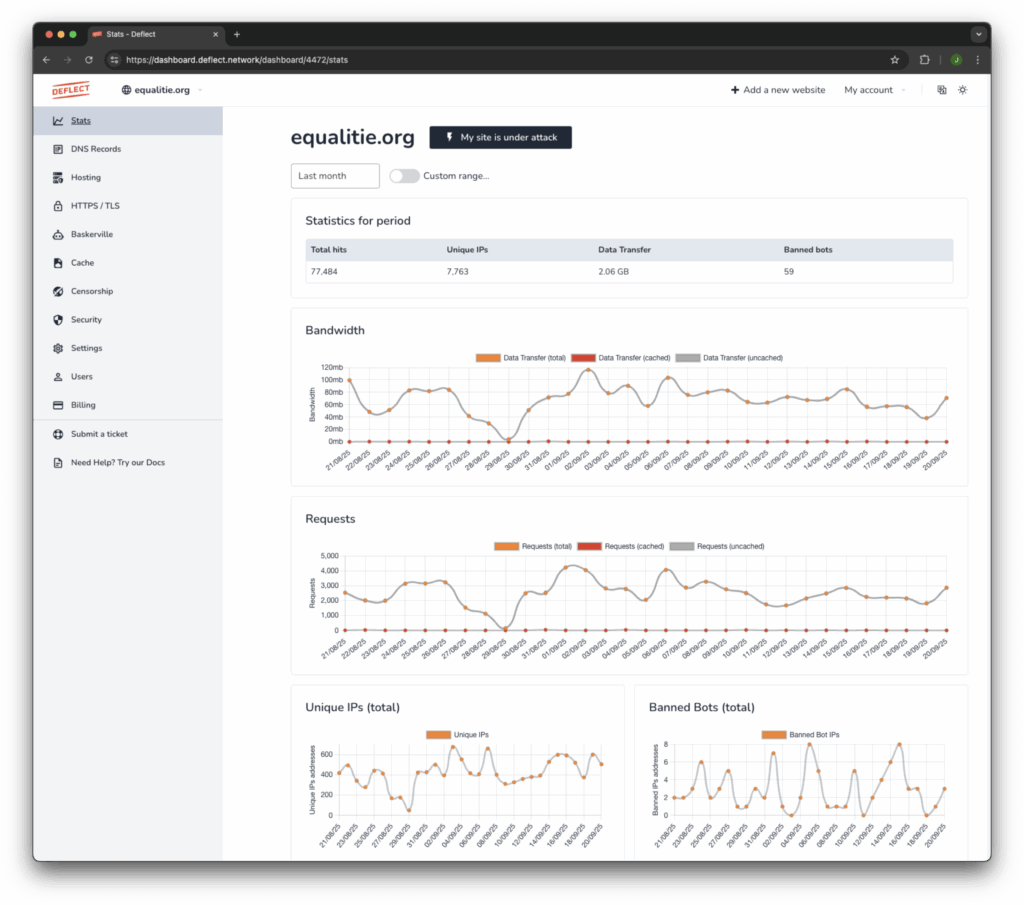
The Stats tab is the first thing you will see when accessing the Dashboard. Here you will find graphs with statistics on the traffic directed to your website, including visitors and banned bots.

When you access the Dashboard, the default time range of your graphs is the last 30 days, but you can change this value to the last hour or the last 12 months by clicking on the time range drop-down menu in the top left corner of the tab.
By selecting “Custom range”, a calendar will appears that allows you to select a starting date and then visualize the statistics for a week, a month or a year starting from the selected date.
Please note that because of the huge amount of data we have to process, numbers are in some cases approximate (read this page for a scientific explanation of one of the approximations). Accuracy normally varies between 90% to 100%, with tables showing the top countries, user agents and URLs being the most approximate.
Normally we expect logs to arrive into Dashboard within a few seconds, but sometimes there are issues with log delivery, like maintenance work or the occasional unplanned outage somewhere in the system. Data from more than a couple of days ago should always be reliable. Very recent data like “Last hour” is not guaranteed to be accurate.
Charts #
The data visualized in the graph include:
- Statistics for period – the total number of:
- requests received by your website (Total hits),
- unique visitors (Unique IPs),
- volume of data transferred from your website to your visitors’ computers (Data transfer),
- IPs identified as malicious and banned by Deflect (Banned bots)
- Bandwidth: the volume of data transferred from your website to your visitors’ computers over the selected time range
- Requests: the requests received by your website
- Unique IPs (total): the unique visitors sending requests to your website
- Banned Bots (total): the IPs identified as malicious and banned by Deflect
- Cache Hit/Miss: The percentage of resources that were already available in the cache of your website stored in Deflect’s edges (“Served from cache”) and of resources that weren’t stored in the cache and had to be retrieved from your web server (“Served from origin”)
- Banned Bots by country (top 10): the top ten countries of Bots targetting your website, viewed over time
- Top Countries: The top countries of origin of requests received by your website
- Top Bot Countries: The top countries of origin of malicious bots
- Top URLs: the most requested objects in your website, including all site artefacts like javascript, css, etc.
- HTTP status codes: the status code included in the responses sent by your website to your visitors to indicate the reasons for the availability or unavailability of the requested resource – https://en.wikipedia.org/wiki/List_of_HTTP_status_codes
- Top User Agents: the browser used by your public to visit your website, as well as the spiders and crawlers that have visited your website. Malicious bots spoof their user agents most of the time, masquerading for example as “Wordpress” or “Opera” – https://en.wikipedia.org/wiki/User_agent
- Top Viewed Pages: the most visited pages in your website, not including site artefacts like javascript, css, etc.
- by your website from each country
- Hits by country (top 10): the top ten countries of requests to your website, viewed over time
- Top Traffic Sources: A map of the number of requests received by country
